Expert Market Analysis for Your Business

Unlock insights with our comprehensive market report analysis tailored for your business needs.

Rated 5 stars by clients

★★★★★

MARKET ALERT!

THE SOX INDEX MADE A GREAT BOTTOM OPPORTUNITY FOR A SHORT TERM TRADE USING THE DOJI CANDLE AS A STOPLOSS - GENERATING INTRADAY A FOLLOW UP OF APPROX 200.00 POINTS (4500-4700)
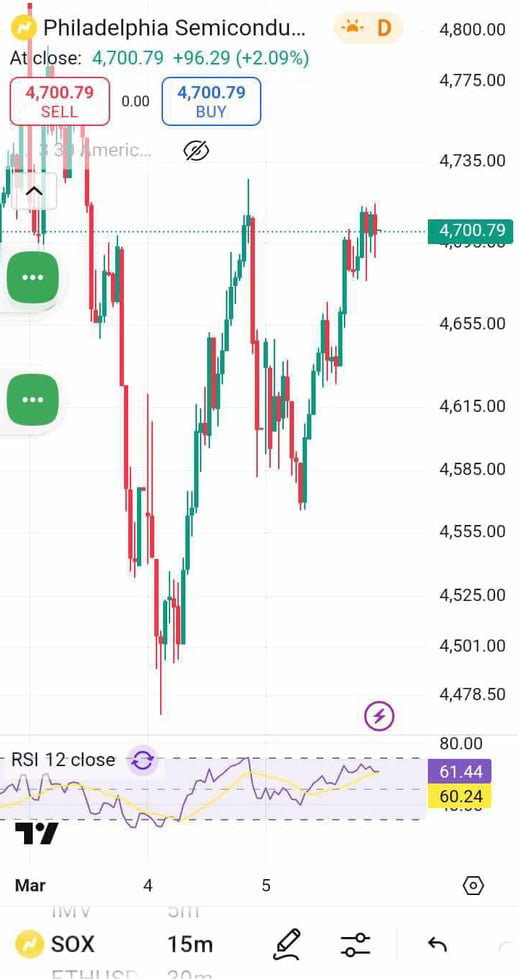
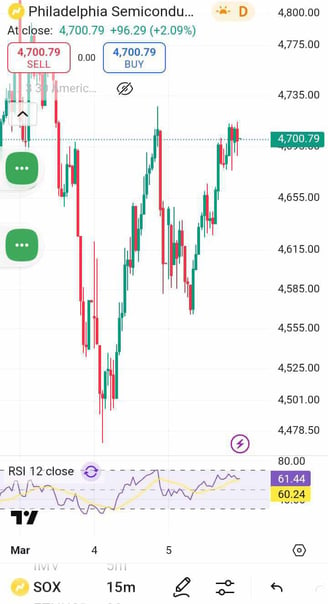
END OF ALERT

Market Insights

Explore our comprehensive analysis of market reports and trends.

A person is presenting in front of a whiteboard filled with detailed marketing diagrams and notes. Several people are seated, paying attention to the presentation. The setting appears to be a professional workshop or meeting room with natural light coming through large windows.
A computer screen displays a financial dashboard with stock market data, including indices like S&P 500 and NASDAQ, along with commodities like gold prices. A red line graph shows a declining trend, indicating negative market performance.
A computer screen displaying a data analytics dashboard with graphs and charts. A blue line graph shows fluctuations in data over time, and a section highlights the number of page views. A pie chart is partially visible, indicating a breakdown of different data elements.
A digital stock trading interface with the focus on AMC Entertainment Holdings, Inc. The screen displays various financial data including stock prices, volume, and market cap. A red line graph shows stock performance over time and several buttons allow for different time frame selections like 1W, 1M, and 1Y. Various stock metrics appear in rows and columns.
A person is looking at a computer screen displaying a document titled 'Overview - All Private Equity - Fundraising, Investments, & D'. The document contains statistical charts and graphs related to private equity market statistics from 2007 to 2022. Various tabs and functions like 'File', 'Home', 'Insert', and 'Design' are visible in the interface.
A newspaper page focused on financial information, including stock market data, recent issues, rates, major price changes, and investment fund details. Columns of numbers are interspersed with headings and small charts, printed on plain paper with a slightly off-white background.